Notes on the plot command
A commonly-used plotting tool for Linux is gnuplot. However, it is more complicated than we need, and has more features than we need, so I’ve written an interface to it simply called plot. To use it, first
prepare a data file containing the data you want to plot. Most of the time you’ll be doing this using your own code and the output redirection operator >, but you can also do it by just creating a file in a
text editor with the data to be plotted in two columns, like so:
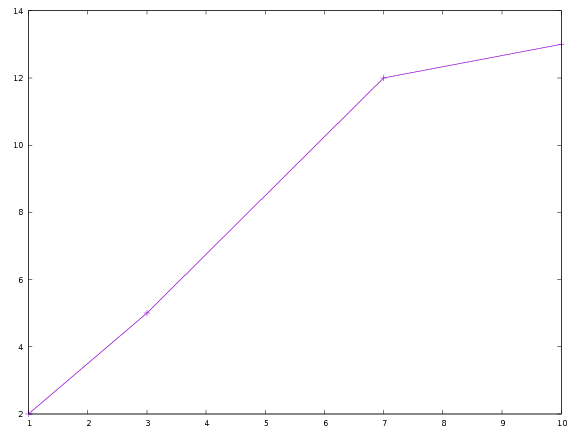
1 2
3 5
7 12
10 13
Suppose you save that file and call it data.txt. You can then make a plot of those data by typing plot data.txt.
You’ll see the following:
Plotting multiple files
If you have multiple data files you want to plot, you can do plot file1.txt file2.txt ... Plot will plot them all on the same set of axes in different colors.
Plot options
You can pass options to plot to do a couple of different things:
Log-log plots
Use the -l switch to plot data on a log-log scale:
plot -l scaling.txt
Labelling things
Use the -lx and -ly options to specify labels for the axes, and -t to title the graph. If your labels or titles are more than one word long, put them in quotes.
plot -lx Time -ly Snowfall -title "Snowfall vs. Time"
Note that -xl and -yl work too, so you don’t have to remember which way it goes.
Making PDF’s
Ultimately, you’ll need to save your plots to turn them in. Use the -o option, like you do for the compiler:
plot -lx Time -ly "Covfefe Quotient" -t "Covfefe vs. Time" -o covfefe.pdf